See the
difference
between
imaging
and insight.
No longer do you have to choose between viewing anatomical structures and
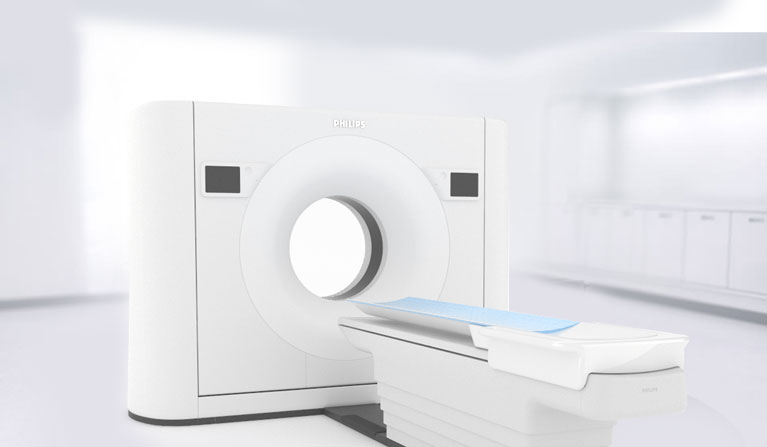
identifying material composition. Philips IQon, the world's first spectral detector-based CT,
lets you do both with in-depth spectral information on demand and retrospective analysis, at low-dose.
One case, two ways
To illustrate the power of IQon Spectral CT, we present two hypothetical patients with identical health profiles, both complaining of abdominal pain. Their doctors schedule CT scans to learn more. One patient undergoes a traditional CT scan, while the other gets an IQon Spectral CT scan. The process is the same for both patients, and the workflow is nearly identical for the hospital staff.
Traditional CT patient
Connor P.
- Age: 51
- Height: 6'0"
- Weight: 175 lbs
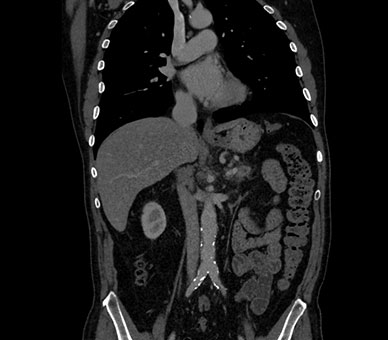
- Abdominal CTA scan with a 70-second
contrast injection delay

IQon Spectral CT patient
Tom M.
- Age: 50
- Height: 5'11"
- Weight: 165 lbs
- Abdominal CTA scan with a 70-second
contrast injection delay


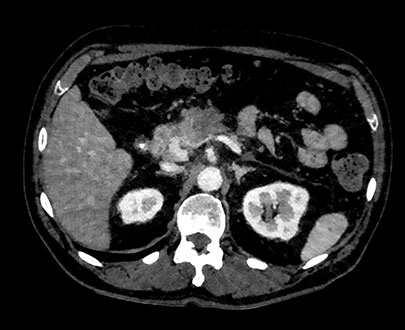
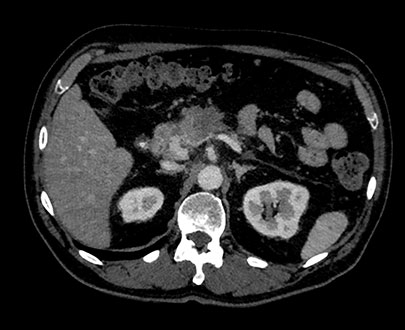
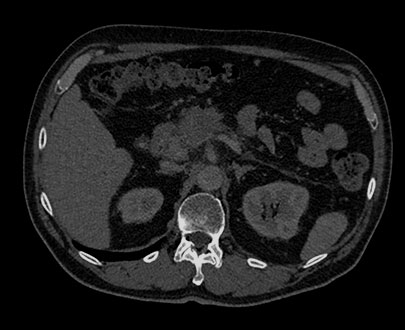
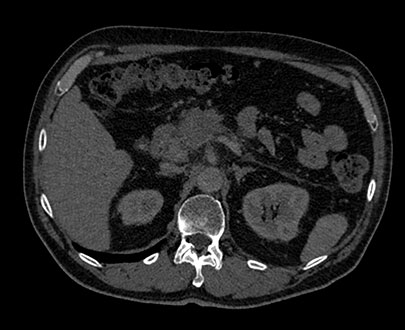
Each CT produces a conventional CT image that shows anatomical structures in the abdomen.
Traditional CT image
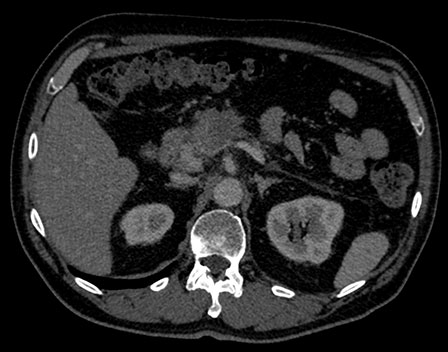
IQon Spectral CT image

But what if one view isn't enough?
In this hypothetical example, the radiologists need more information about a visible mass in the pancreas. They have to be able to confirm the material composition in order to make a confident diagnosis.
Traditional CT
With a traditional CT, if the image is inconclusive, the patient may be asked to return for an additional scan.
IQon Spectral CT
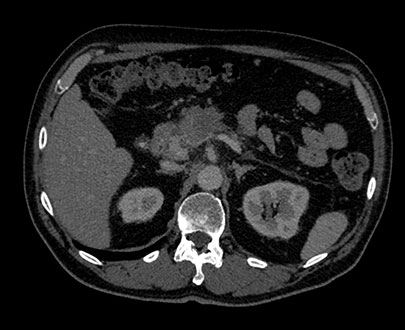
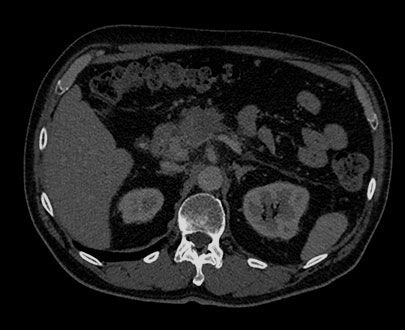
Unlike traditional CT images, IQon Spectral CT images capture spectral information every time — without special planning or set-up. That means you can analyze the spectral data in any image retrospectively, using a variety of spectral viewing tools. You can do things like adjust the monoenergetic level and isolate material composition. Try it yourself below.
- 45 keV
- 55 keV
- 75 keV
- 85 keV
- 115 keV
- 125 keV
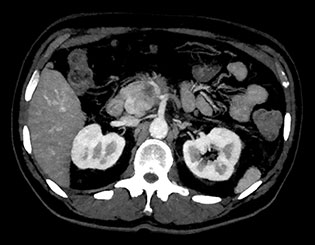
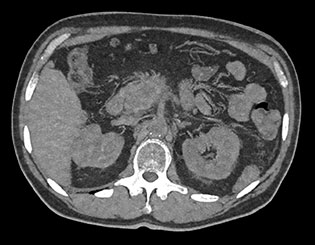
The MonoE view shows synthesized monoenergetic images at predefined keV values from 40 to 200. The appearance of the images changes as the keV values change, even when the window/level settings are unchanged. For example, at lower keV, iodine may appear brighter, and at higher keV, metal artifacts may be reduced.
-
MonoE
-
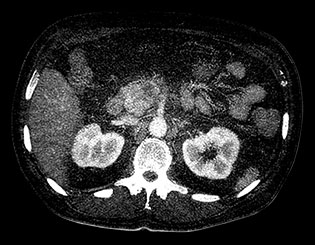
Iodine
no H2O -
H2O
no iodine -
Effective Z
-
This view shows a synthesized monoenergetic image at a predefined keV value.
-
Here, pixel values represent the iodine concentration of the displayed tissue in mg/cc. Water-like tissues are identified and suppressed to let the viewer focus on the distribution of iodine-enhanced tissue.
-
This view shows iodine-free images in which the pixel values represent water-like tissue concentration in mg/cc. Iodine is identified and suppressed to let the viewer focus on tissue without the iodine.
-
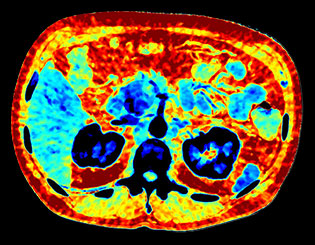
Here we have a series of images where voxel values represent effective atomic number. Effective atomic number can be a fractional number, representing any element, compound or mixture. The number may be different than the atomic number as defined in the Periodic Table. The unit is simply Z.
Conventional CT
IQon Spectral CT
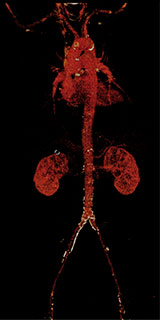
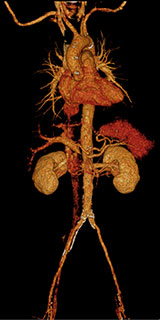
These images show the delayed contrast injection in both a conventional image and a spectral image. The spectral MonoE image has been adjusted to 55 keV for increased detail. Only IQon spectral imaging allows this type of retrospective adjustment.
Key features
Spectral detector
Spectral detector technology identifies photons of high energy and low energy simultaneously, allowing you to view both anatomy and tissue composition. And unlike traditional dual-energy CT, spectral is always on.
Retrospective analysis
Spectral CT allows for retrospective analysis using the spectral data collected from each scan. Scan once and get sophisticated data that you can manipulate for a confident diagnosis.
Traditional workflow
IQon Spectral CT requires no special planning or set-up. It uses the same iPatient workflow as traditional Philips CT systems, meaning quick and easy integration for hospitals.
Low radiation
IMR not only improves conventional image quality, it also achieves 60 – 80% dose reduction.*
* In clinical practice, the use of IMR may reduce CT patient dose depending on the clinical task, patient size, anatomical location, and clinical practice. A consultation with a radiologist and a physicist should be made to determine the appropriate dose to obtain diagnostic image quality for the particular clinical task. Lower image noise, improved spatial resolution, improved low-contrast detectability, and/or dose reduction, were tested using reference body protocols. All metrics were tested on phantoms. Dose reduction assessments were performed using 0.8 mm slices, and tested on the MITA CT IQ Phantom (CCT183, The Phantom Laboratory), using human observers. Data on file.
Business value
Enhance your diagnostic confidence with spectral data and save time and money by providing more data with a single scan. IQon Spectral CT can also boost your hospital’s reputation as a leader in cutting-edge technology, helping attract patients and top medical professionals alike.
Contact us
Please contact us for more information
about the IQon Spectral CT scanner.
